
Our mind constantly tries to make sense of the world. Whenever something happens, it either falls into the category of “yes, we live in a world where this is possible”, or “the fuck was that?”
If it falls into the latter category, we look for explanations in the events that preceded whatever surprised us and adjust our view of the world to accommodate this new information.
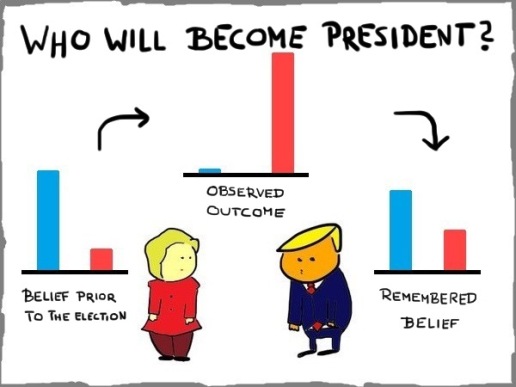
This can be major or minor adjustments such as “we live in a world where Donald Trump can become president” or “we live in a world where chocolate pizzas are a thing”.
Once we have updated our view of the world though, it is incredibly difficult for our mind to reconstruct former beliefs we’ve held. This of course has its own benefits and for the most part of human history there wasn’t a need to do so (why reconstruct the belief that lions won’t try to eat you?).
Yet, the same cognitive mechanisms that help us adapt to an ever changing and complex world are also behind one of the most robust and well known cognitive biases.
Hindsight bias
Hindsight bias is the phenomenon that events appear more predictable after they have happened. It is one of the most widely studied cognitive biases:[1]
Usually, participants in an experiment are asked to make a prediction considering an event in the future. After some time has passed and the outcome of the event is known, the same people are asked to recall the probabilities they assigned to the outcome…and overestimate the accuracy of their past predictions.
One explanation how hindsight bias can arise is that after the outcome of an event is known, our mind will build a story to explain it.
Information in line with the outcome of the event is given more weight than information in contrast to it. This leaves us with the impression that the outcome was more understandable and therefore more predictable than it actually was.
“Your inability to reconstruct past beliefs will inevitably cause you to underestimate the extent to which you were surprised by past events.” Daniel Kahneman writes in his book Thinking, Fast and Slow.
He adds: “Hindsight bias has pernicious effects on the evaluations of decision makers. It leads observers to assess the quality of a decision not by whether the process was sound but by whether its outcome was good or bad.”
Now let’s see what that means for football.
Liverpool vs. Chelsea
Hindsight bias causes us to overestimate our ability to forecast events. This is why it’s important to express predictions as clearly as possible.
To illustrate this, let’s look at these two differently framed predictions that basically predict the same outcome for a hypothetical game Liverpool vs. Chelsea:
Liverpool has a fair chance to win against Chelsea
What is a fair chance? Is it a 50/50 chance or does fair just mean ‘reasonable’? Exchange Liverpool with Burnley. Does the meaning of the prediction change? This prediction leaves so much room for interpretation that it can be seen as spot on in hindsight.
Liverpool has a 42% chance to win against Chelsea
This is a clearly defined prediction. No matter the outcome of the match and how we feel about this prediction when we reevaluate it, its meaning will not change.
A downside to expressing predictions with numbers though is that they might come across as an objective truth and not as the subjective judgment they really are.
However, using numbers can actually help avoid overconfidence in predictions, because they also become accountable.
Measuring the quality of predictions
Saying Liverpool has a 42% chance to win also means that there is a 58% chance they won’t. We can’t judge a single forecast alone, because a prediction should cover all possible events, while the actual result is only one out of all possible outcomes.
But we can collect large sets of forecasts and determine how far off (or close to) reality those predictions were.
The technical term for this is calibration. The blue line in the following graph represents perfectly calibrated predictions: in all games were the home team was given let’s say a 60% chance of winning, 60% of those times the home team won, 40% of the time they didn’t.
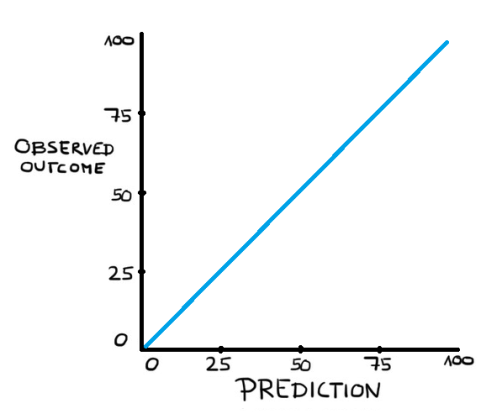
We can take a large set of predictions and create small ‘bins’ (for example all predictions close to 60%) and match those to their outcome rate. The aim of everyone trying to predict football matches should be for their prediction bins to be as closely to this blue line as possible. The closer those bins are to the blue line, the more reliable were the predictions.
But to measure the quality of a set of predictions, we need to know more than just how well calibrated they are, as the next example should show:
If we were to just take the baseline of the last three Premier League seasons (there were 45% home wins, 24% draws and 31% away wins) and apply this to predict every single match of the current 2016/2017 season (49% home wins, 23% draws and 28% away wins after 29 weeks) the prediction bins would be really close to the observed outcome.
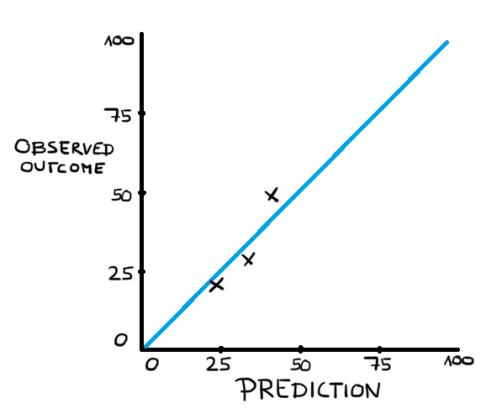
However, assigning Hull City a 45% chance to win at home against Chelsea might not be the best idea. It seems obvious that each prediction should adjust to the individual settings of each game. This is called resolution. A good prediction model will achieve a high resolution while remaining to be well calibrated.
The Brier Score and Ranked Probability Score
There are various statistical methods that capture the calibration and resolution of forecasts.
What those methods basically do is to measure the gap between what was predicted and what really happened. If the gap is big, the prediction model gets penalized, if it’s only a small gap, the model gets rewarded and after a large set of games have been predicted and evaluated, a track record can be calculated.
A simple illustration of how these ‘gaps’ can be calculated is the Brier Score method. Usually, the Brier Score is used to determine the quality of weather forecasts.
Let’s say we predict that there is a 80% chance of rain tomorrow. The formula for the Brier Score of this prediction would be:
(Observed outcome – prediction) squared = Brier Score
This means if it rains:
(1 – 0.8)^2 = 0.04
If it doesn’t rain:
(0 – 0.8)^2 = 0.64
A low Brier Score means that the gap between what was observed and what was predicted was low (this is good). To calculate the Brier Score for a set of predictions, just take the Brier Score for every single event and calculate the mean (average) Brier Score.
It is important though to note that the Brier Score, or any other statistical method that evaluates the quality of predictions, only becomes meaningful after assessing a large sample of predictions.
Using the Brier Score on small samples can lead to dangerous conclusions as I mentioned in this article here.
What is also important is that the Brier Score is dependent on the general uncertainty of the events it is trying to predict. A weather forecaster in the Sahara desert will probably have a much lower (better) Brier Score than a weather forecaster in Berlin, Germany.
The same goes for football predictions. The Brier Score of someone predicting the Premier League will be much lower than the Brier Score of someone predicting the Championship. It is therefore essential to use the same set of games when we try to compare prediction methods.
What the Brier Score doesn’t capture though is that football outcomes are ranked. A home win is further away from an away win than a draw would be.
The Brier Score for both of these predictions would be the same if the home team won:
Prediction 1: Home win 50%, draw 20%, away win 30%
Prediction 2: Home win 50%, draw 30%, away win 20%
The second prediction is a bit closer to the observed result and a scoring rule should capture that.
This issue was addressed by Constantinou and Fenton in their paper Solving the problem of inadequate scoring rules for assessing probabilistic football forecasting models where they propose to use the Ranked Probability Score (RPS).
The RPS is sensitive to a draw being closer to a home win than a away win would be. The RPS for Prediction 1 would be 0.17 where the RPS for Prediction 2 would be 0.145.
If you want to calculate the RPS for your own predictions you can check out @opisthokonta’s blog where he published the R code for it here.
[1] There are different forms of hindsight bias. If you want to know more about research on hindsight bias I suggest you start with Baruch Fischhoff, who first documented this effect.

Great article, yet again! Use of the Brier Score is very well explained.
I’m especially interested if the Brier Score is useful for comparison a model against the bookmaker’s (model).
Say I have a set of 2500 bets, both with bookmaker’s price as well as my price predictions, like this:
BET BOOK PRICE MY PRICE RESULT
BET #1 1.9 1.71 W
BET #2 2.2 1.9 L
…
From this I’d be able to calculate the Brier Score for both the bookmaker’s ‘model’ as well as my model. Let’s say the bookmaker has a Brier Score of 0.439 and my model yields a Brier Score of 0.329.
Would this imply that my model is ‘better’ (since it has a better score) and can be used to identify value bets against bookmaker’s with a higher score? Or would you consider both models not good enough since the overall scores are both relatively high…
Thanx for your great work!
Chris
LikeLiked by 1 person
Hey Chris, thanks I appreciate that!
I’m a bit reluctant telling people that “they will be able to beat the market” but in your example with the lower Brier Score of 0.329 and the higher Brier Score of 0.439 I would definetly say that the model with the lower Brier Score is superior
I don’t use the Brier Score personally for my predictions anymore, but I calculated the results for my Premier League predictions so far:
Model: 0.5529
Odds: 0.5516
Just to give you a feeling how “close” the Brier Scores tend to be. So in this case, the betting odds would be more accurate and I would say that any betting profits are a result of chance. In your example however, the Brier Scores indicate a much more superior model (or probably that something in the calculations went wrong, also a possibility :P)
I calculated the Brier Score like this:
(OutcomeHome – Home prediction)^2+(OutcomeDraw – Draw prediction)^2+ (OutcomeAway-Away prediction)^2
Oh, and I wouldnt rule anything out because both Brier Scores seems high. Brier Score is automatically higher in lower leagues or in more competitive leagues. Its essential however to use the same set of games when comparing models
Cheers,
Alex
LikeLike
Thank you for the detailed explanations, Alex – especially for the hands-on example on how to calculate the Brier Score for football. The two Brier Scores I provided were not actual ones, but just for demonstration purposes. Just calculated the real Brier scores from a sample of 949 golf bets and they are 0.2466 (book’s model) and 0.2431 (my model), so both almost identical.
The model will calculate probabilities of ‘Player X’ beating ‘Player Y’ in a tournament (= higher rank at the end of the tournament, if they have the same rank the bet will be voided).
It seems a bit tricky to apply a proper Brier Score for both models since it’s not only W/L (or 0/1) that counts (just like in football), but the Brier Score should presumably also take into account by what margin player x beats player y, shouldn’t it? Not sure how to get my head around this…
LikeLike
Also what would you consider a significant difference to consider a model superior over another? I have to Brier Scores from another prediction model with 0.346 (book’s) and 0.297 (my model), however I’m missing experience to judge whether this is ‘good enough’.
Thanks for all your help!
Chris
LikeLike
And yet another question that lures in my head and caused me a sleepless night 🙂 Given the same dataset from above
BET BOOK PRICE MY PRICE RESULT
BET #1 1.9 1.71 W
BET #2 2.2 1.9 L
In order to calculate the Brier Score for the book’s model, would I need to remove the overround from the book’s price?
E.g. in the example above the bookie priced up the first bet at 1.9, this would imply a probability of 1/1.9 = 0.526315789, however the book’s margin is included in this probability. I assume the vig-free bookie prices have to be derived prior to calculating the Brier Score or am I getting something wrong here?
Apologies for all the questions, but the Brier Score looks to be a reliable way to judge my model against the books’, so I would really love to work this out properly.
Thanx again!
Chris
LikeLiked by 1 person
Sure, I’m happy to talk about this! I personally remove the margin before I calculate the scores for the bookmakers. The BetBrain model I use for the Premier League model comparison for example is the highest available odds and those adjusted to add up to 100%
I can’t say what difference in Brier Scores is “enough” though, since the predictions need to me not only more accurate, but in a sense that they also “swallow” the margin.
And its important to realise that scoring rules still can result in some false positives. I try to adjust for that with the z-scores in the link I posted.
If you want to we can discuss this further. I’d suggest you dm me on twitter if you have any more questions?
LikeLike
Thank you very much, Alex! Highly appreciated. In order to avoid spamming, I will contact you on twitter for future discussions 🙂
Cheers,
Chris
LikeLiked by 1 person
Excellent! This is what I was looking for a while. Thank you!
I was thinking how the Brier score for domestic leagues conpare to the WC for example? (where home advantage doesnt matter at least for 31/32 teams)
Would Int’l rankings, strength of confederation, history, etc. affect prediction or outcome?
LikeLike
Hey Sam,
I use the RPS over the Brier Score because if let’s say the home team won, to change the result to a draw the away team has to at least score one more goal. To change a home win to an away win the away team has to score at least two more goals. So an away win is automatically further away from a home win than a draw by at least one goal.
Home field advantage (or the lack of) should be captured equally well by both scoring rules.
LikeLike